Amazon Selling
Amazon Seller Reporting Automation: Stop Spending Hours Collecting Data
12 min read
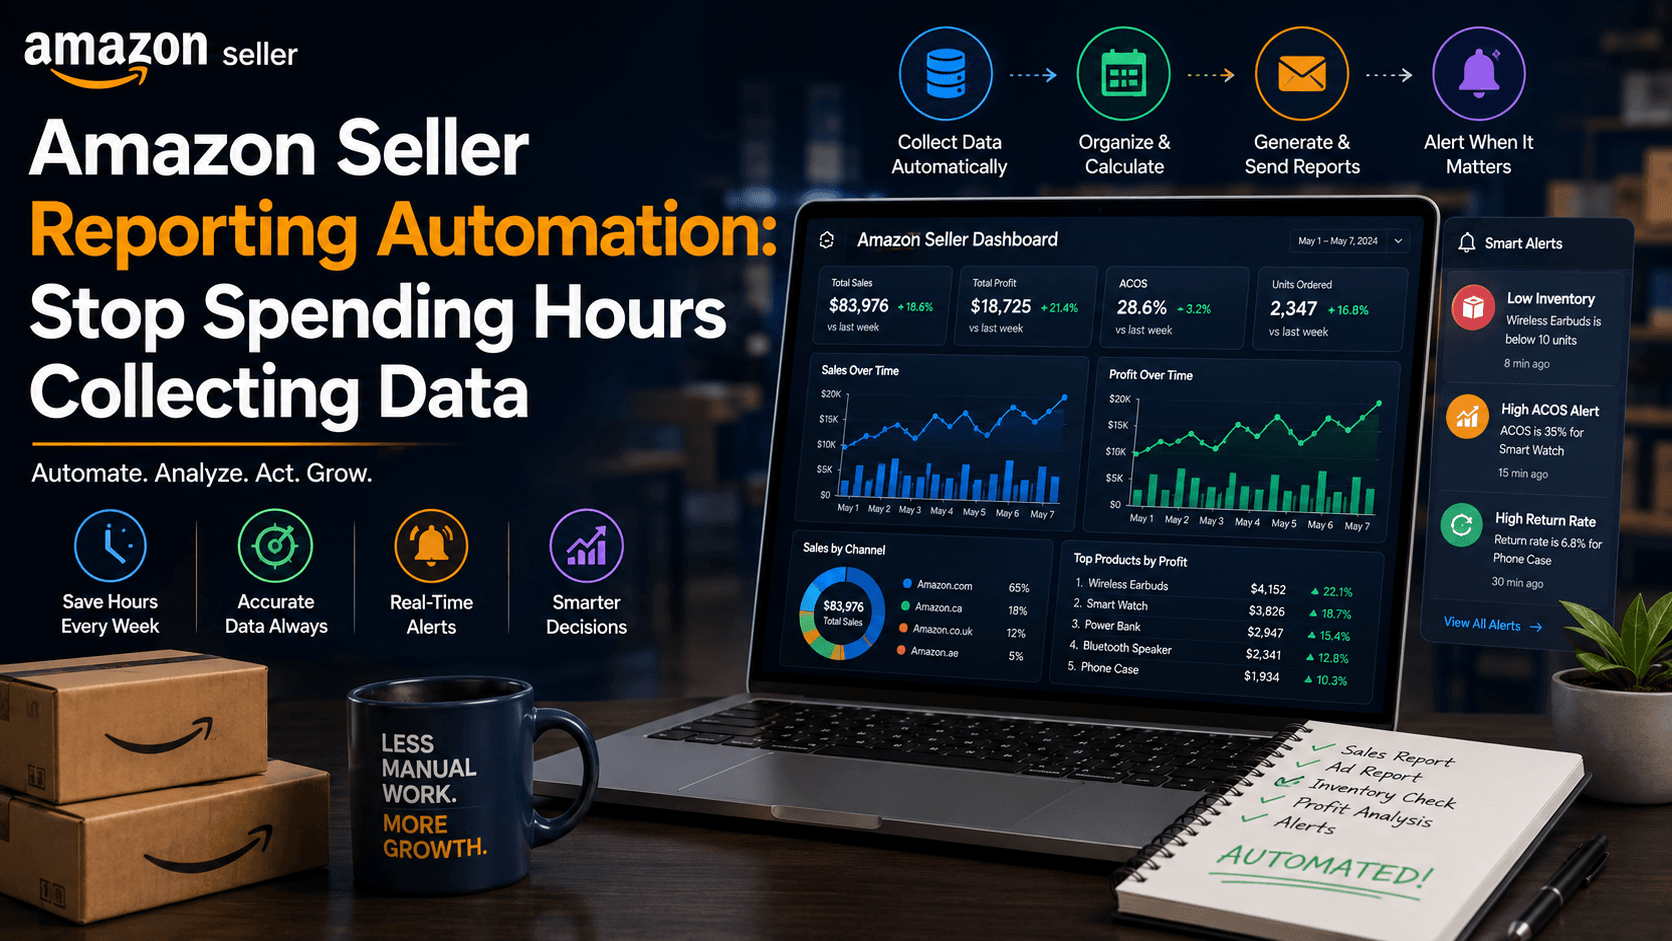
Running an Amazon business is like flying an airplane. You need real-time information on every system. What is your altitude? How much fuel do you have? Are the engines working properly?
Amazon sellers face the same problem. You have sales data in one place. Advertising information in another. Inventory numbers somewhere else. Profit calculations scattered everywhere.
Most sellers without a unified analytics dashboard waste 15-20 hours per week gathering data. They make slower decisions. They miss opportunities. They lose money.
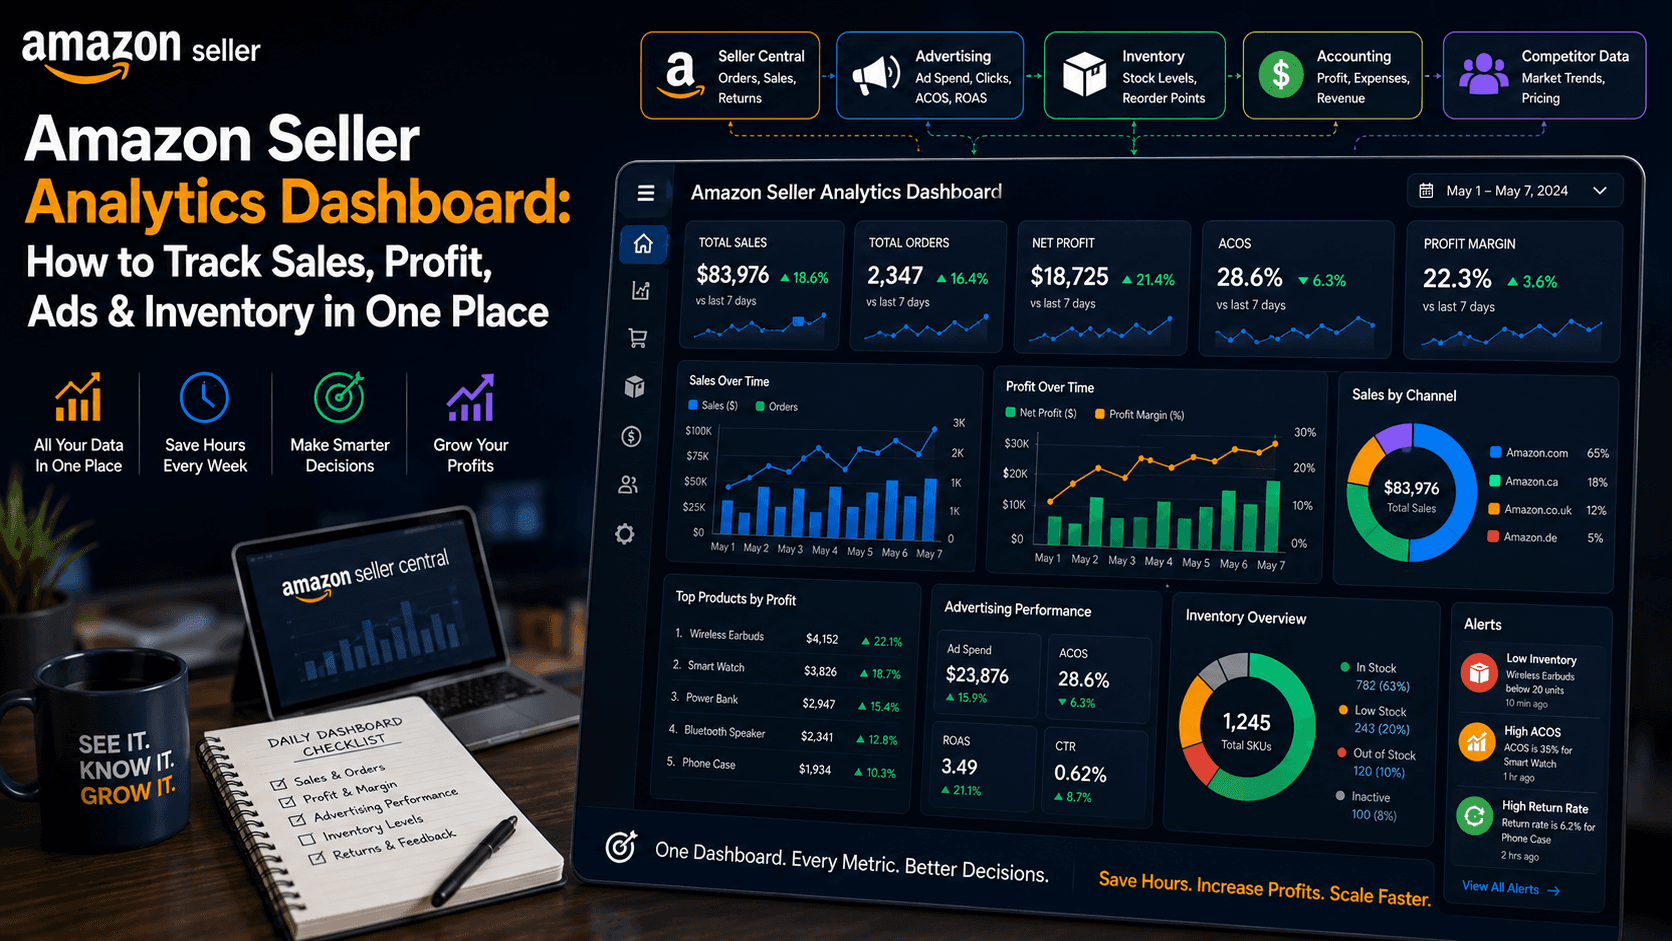
An Amazon seller analytics dashboard is a single screen showing all your important business metrics. It pulls data from:
All information appears on ONE screen, updated every few hours. You open the dashboard and see your entire business in 30 seconds. Once your dashboard is built, combine it with reporting automation to save even more time.
Monday morning:
That is 1.5 hours just gathering data. Per day.
Your Seller Central says you sold 100 units. Your inventory system says 95. Your accounting shows 102. Which is correct? You waste hours investigating.
Your advertising ACOS is going up. But you check only twice per week. By the time you see it, you have wasted $500 on bad keywords.
Your best-selling product is running out of stock. You check inventory once daily. Customer cannot buy. You lose $200 in sales. Using smart inventory forecasting prevents these losses.
When data is scattered, you ignore important numbers:
Essential sources:
Sales Metrics: Revenue, Units sold, Average price, Growth rate
Profitability: Gross profit, Net profit, Profit margin %, Profit per unit
Advertising: Ad spend, ACOS, ROAS, Click-through rate, Conversion rate
Inventory: Current stock, Days on hand, Stock-out rate, Turnover rate
Customer: Return rate, Refund rate, Satisfaction score
No manual work. Just automatic data flow. Most platforms also offer built-in reporting automation features.
Your dashboard should be visual:
Includes: Sales analytics, Keyword research, Competitor analysis, Profit calculator
Price: $99-299/month
Best for: Product research and analysis
Includes: Sales dashboard, Advertising analytics, Inventory management, Keyword research
Price: $99-999/month
Best for: Serious, full-time sellers
Includes: Unified dashboard, AI advertising optimization, Profit calculator, Inventory alerts
Price: $99-299/month
Best for: Sellers who want automation and intelligence
Includes: Custom dashboards, Connect any data source, Automated reports
Price: $75-600/month
Best for: Advanced sellers with specific needs
Before: Spent 3 hours daily gathering data from 5 tools
After: Implemented unified dashboard, reduced to 20 minutes daily
Results: Saved 14 hours/week, increased profit by $8,000/month, cut advertising ACOS from 35% to 22%
Before: Did not realize one product category was losing money
After: Built dashboard showing profit by category
Results: Found $24,000 in additional annual profit just from data visibility
1. Keep It Simple - Track 8-12 metrics that matter, not 100
2. Update Regularly - Review your dashboard daily
3. Set Realistic Targets - ACOS 25-35%, Profit margin 15-30%, Return rate below 3%
4. Act on Insights - A dashboard is useless if you do not use it
5. Review Monthly - Look at trends and adjust strategy
Mistake 1: Ignoring low-performing ads - Turn them off immediately
Mistake 2: Not checking inventory - Real-time alerts prevent stockouts
Mistake 3: Trusting only one metric - Look at profit, not just sales
Mistake 4: Not tracking return rate - Quality problems damage reputation
Mistake 5: Set and forget - Use your dashboard daily
An Amazon seller analytics dashboard is not a luxury. It is a necessity. Sellers without one waste hours and make slower decisions. Sellers with one see their business clearly and make better decisions faster.
Start today. Choose a platform. Build your dashboard. Use it to improve your business. In a few weeks, you will wonder how you ever ran your business without it.
Let's discuss how these insights apply to your specific challenges.
Get in Touch