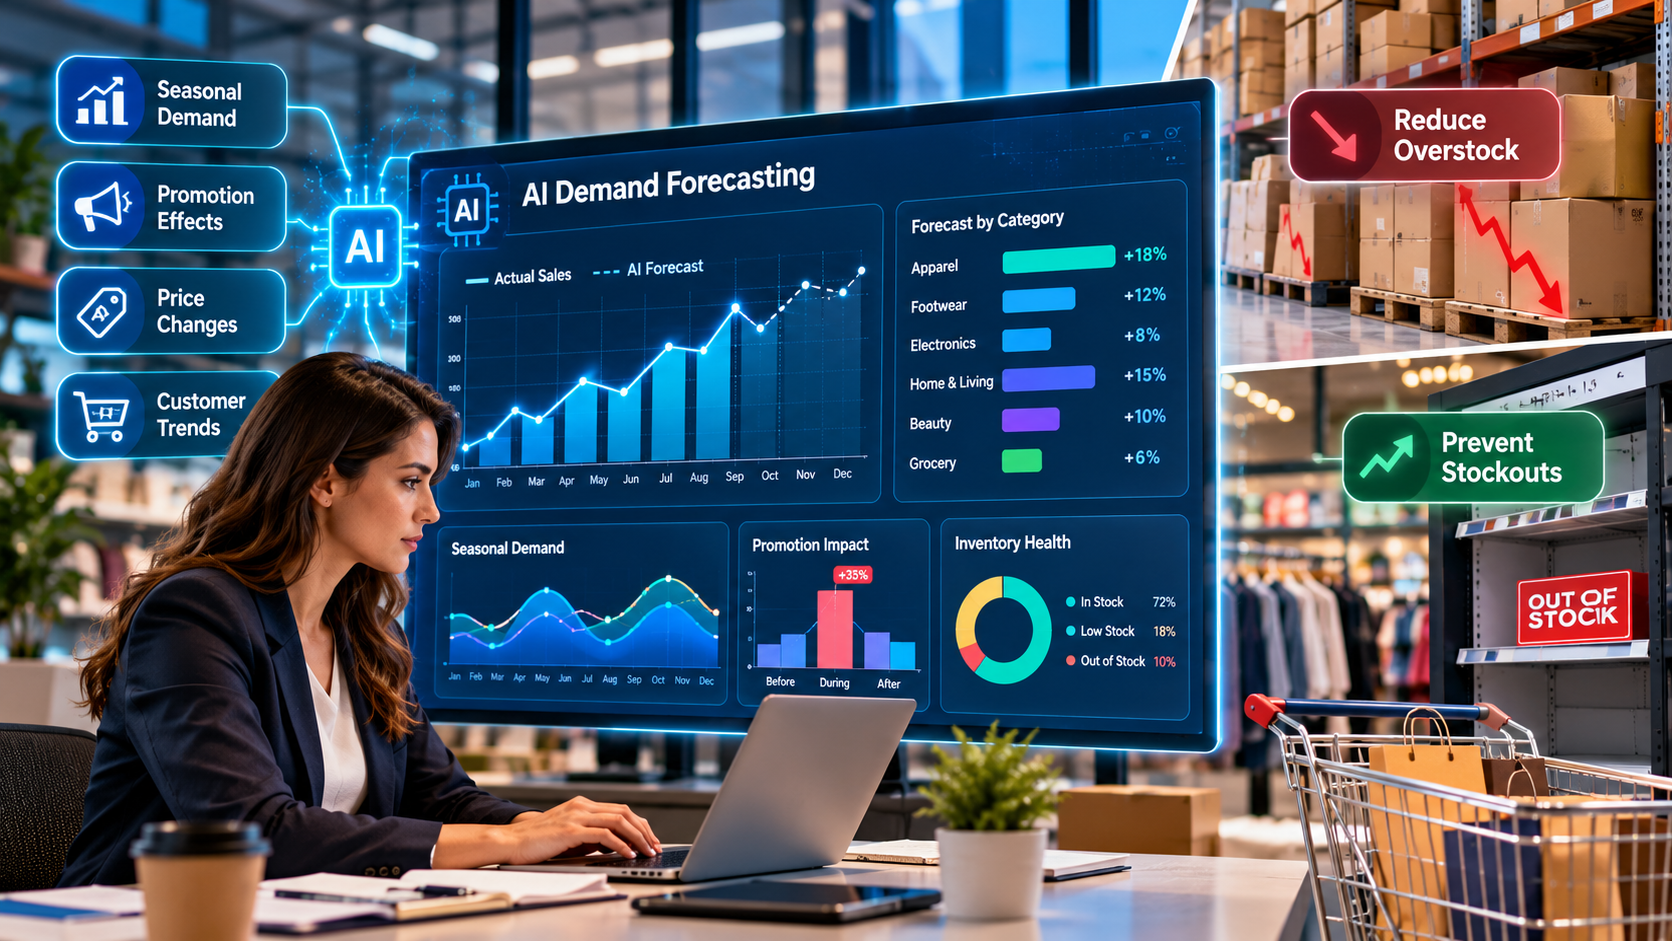
AI demand forecasting helps retailers predict how much of each product customers will buy, by store, channel, and time period. It uses sales history, seasonality, promotions, prices, and other signals. When the forecast is closer to real demand, teams order the right amount. That reduces overstock, which ties up cash and leads to markdowns, and it also reduces stockouts, because replenishment decisions are based on better predictions. The approach works best with clean sales data, a clear forecast horizon, and an evaluation process that measures both forecast error and the business cost of getting it wrong.
Every retailer has felt this problem. A winter coat sells out in one store while the same style sits unsold in another. A popular snack runs out during a promotion, but the warehouse is full of a flavor nobody wants. The planning team is working hard, yet the shelves still feel wrong. In most cases, the cause is not a lack of effort. It is a forecast that does not reflect how demand actually moves.
This guide explains how retailers can use AI demand forecasting to reduce overstock without increasing stockouts. It covers why traditional methods miss, the data you need, a step-by-step implementation approach, and how to evaluate a forecast so you know it is working. The examples are practical, and the one illustrative scenario is hypothetical and labeled as such. If you want outside help with the model, our machine learning forecasting services can cover the full build and monitoring.
Why retailers end up with too much stock and too little stock at the same time
Overstock and stockouts often come from the same root cause. The forecast is wrong, and it is wrong in different directions for different products, stores, and weeks. A retailer can hold too many winter jackets in one region and run out of medium sizes in another, both in the same week.
Overstock costs money in several ways. Cash is tied up in inventory that has not sold. Storage and handling add cost. Slow items must be discounted to clear, and in some categories, unsold goods are written off when they expire or go out of style.
Stockouts cost money too, though the cost is less visible. Lost sales are the obvious part. Customers who cannot find what they want may buy from a competitor, and some do not come back. Repeated stockouts also weaken trust in the brand.
Many teams try to fix one side at a time. They order less to cut overstock, and stockouts rise. They add a larger safety buffer to protect against stockouts, and overstock grows. Changing the buffer shifts the problem around without solving it. The better goal is to make the forecast more accurate, so the buffer can be smaller and orders can be closer to real demand. That is where AI-based forecasting can help.
Where spreadsheet and rule-based forecasts break down
Most retail planning still starts with last year's sales, adjusted by a planner's judgment. For stable products with steady demand, this can work well enough. It breaks down in several common situations.
Seasonal demand. Outerwear, school supplies, and holiday items rise and fall on a predictable calendar. But the peak shifts from year to year, and it differs by region. A simple average of last year's weeks misses the shape of the curve. It also misses how a late cold snap or an early school start changes the pattern.
Promotion effects. A 20% discount on a product may lift sales of that item, pull demand forward from the following week, and reduce sales of similar products on the shelf. Spreadsheets rarely capture all three effects at once. Planners often compensate by guessing, which is hard to repeat and hard to measure.
New and short-lifecycle products. A new item may have no sales history. Fashion and seasonal products may sell for only a few weeks. Forecasts for these items need to borrow patterns from similar products rather than starting from zero or copying a neighbor's numbers.
Local and channel differences. A product can sell well online and poorly in stores, or the reverse. A product that sells strongly in one city may be flat in another. Forecasts that ignore location and channel push the wrong stock to the wrong place, even when the total is correct.
Stockouts hidden in the data. When a product is out of stock, sales drop to zero. A model trained on that data may learn that demand is low, when demand was actually higher and customers could not buy. This is called censored demand, and it is one of the most common hidden problems in retail data. Teams that ignore it often build forecasts that keep repeating past shortages.
Manual overrides without records. When planners change forecasts by hand and do not record why, the history becomes noisy. A model cannot learn from changes that no one documented.
What AI demand forecasting does differently
Machine learning forecasting models learn from many products, stores, and weeks at once. Instead of forecasting one item in isolation, they use relationships across the whole range. A model can learn that a certain category responds to a holiday in a predictable way, or that a promotion on one product tends to reduce sales of a close substitute.
These models can combine past sales with calendar effects, promotion schedules, prices, store attributes, and inventory status. They can also produce a range of likely outcomes rather than a single number. That range is useful when you set safety stock, because it shows how uncertain the forecast is for each product.
Recent research supports the practical value of focusing on recent data. A 2025 study published in the Journal of Digital Economy analyzed a retailer with more than 1.6 million stock keeping units (SKUs). The authors found that current inventory levels, short-term demand forecasts over three months, and recent sales data were among the most influential predictors of stockouts. Recent demand forecasts and sales data predicted stockouts better than longer-term projections of six or nine months.
The lesson for retail teams is straightforward. Keep forecasts close to the decision window, refresh them often, and make sure inventory status is part of the data. Predictive models do not replace planners. They make it possible to test a forecast, see where it fails, and correct the specific cause. For US businesses that want this built and monitored end to end, see our AI and machine learning services in the United States.
Start with the decision, not the model
Before choosing any tool, write down the decision the forecast will support. Common decisions include:
- How many units to order from a supplier for the next delivery cycle
- How much stock to send to each store or fulfillment center
- When to reorder a product, and how much safety stock to hold
- How much to discount a slow-moving item to free up space
Each decision needs a different level of detail and time horizon. A weekly store replenishment decision usually needs weekly or daily forecasts for each store and SKU. A quarterly supplier order may need monthly forecasts by category. A markdown decision may need a forecast of how demand responds to different discount levels.
Document three things for each decision: the forecast horizon (how far ahead), the level of detail (SKU, store, region, week), and the owner who will act on the result. This step prevents a common failure: building a model that is accurate on paper but does not match how the business makes decisions. If the decision itself is still unclear, an AI consulting engagement can map the decisions, data, and success measures before any model is built.
Step 1: Gather the data you need
Most retail forecasting projects need a core set of data. The table below shows the most useful inputs, what each one explains, and where it usually comes from.
| Data | Why it matters | Typical source |
|---|---|---|
| Sales history by SKU, store, and day | The core demand signal | POS, e-commerce orders, ERP |
| Inventory on hand and stockout records | Identifies censored demand | Inventory or warehouse system |
| Promotions and discounts | Explains spikes and dips | Marketing calendar, pricing system |
| Prices and price changes | Shows how demand responds to price | Pricing system or ERP |
| Calendar, holidays, and school schedules | Captures seasonal and event effects | Internal calendar, public holiday lists |
| Product attributes | Helps forecast new and similar items | Product master data |
| Store and channel attributes | Captures location and channel differences | Store master data |
| Returns and cancellations | Converts gross sales into net demand | Order management system |
| Supplier lead times | Sets how far ahead you must forecast | Procurement system |
| External signals such as weather or local events | Can explain local swings | Public or third-party data |
You do not need every row on the first day. Start with sales, inventory status, promotions, and the calendar. Add other signals once you can show they improve the forecast. Adding data that does not help makes the model harder to maintain and explain. If these sources sit in separate systems, retail data analytics work can bring them into one governed dataset.
Step 2: Clean and prepare the history
Data quality decides most forecasting outcomes. Check these issues before any modeling begins.
Stockout periods. Flag every day when a product was unavailable. Do not treat those days as true zero demand. You can exclude those periods from training, estimate lost demand from nearby days, or add a stockout flag as an input to the model. Each option has trade-offs, so pick one and test it.
Returns and cancellations. Decide whether forecasts track gross or net demand, and apply the same rule across the business. Mixing the two makes comparisons unreliable.
Product changes. When packaging, size, or product name changes, the system may treat the new version as a different product. Map old and new SKUs so the history stays connected.
Outliers. A large one-time order from a single customer, a pricing error, or a data entry mistake can distort the model. Investigate before removing anything. Some spikes are real, such as a bulk order from a school district, and should be handled as a separate case.
Missing dates. A store closure, a system outage, or a delayed data feed can create gaps. A missing day that is recorded as zero sales looks like a drop in demand, which is not the same thing.
Keep a written record of every cleaning rule. When a forecast looks wrong later, the record makes it possible to trace the cause quickly.
Step 3: Build features that reflect the real drivers
Features are the inputs the model uses to learn patterns. For retail demand, useful features often include the following.
- Recent sales. Sales from the previous week, the previous month, and the same week last year.
- Seasonality. Week of the year, month, and day of the week. If your fiscal calendar differs from the calendar year, use the fiscal version.
- Holidays and events. Known holidays, school calendars, and local events, marked by region where they apply.
- Promotions. Whether the item was on promotion, the discount depth, the promotion type, and the number of days left in the promotion.
- Price. The current price, and how far it sits from the regular price.
- Inventory position. Whether the item was in stock, and how long it has been available in that location.
- Product and store attributes. Category, brand, size, store format, and region.
Avoid features that leak future information. For example, a feature that shows total sales for the full month cannot be used to predict early-month demand, because it includes the days you are trying to forecast. Leakage makes a model look excellent during testing and then disappoint in production. Check every feature for the question: would this value be known on the day the forecast is made?
Step 4: Start with a simple baseline
Before using machine learning, build a simple baseline. Options include a seasonal naive forecast, which uses the same week last year adjusted for recent growth, or a basic exponential smoothing model. A baseline gives you a reference point for measuring improvement.
If a complex model does not beat the baseline clearly, the added complexity is not worth the maintenance. This is a useful check, because it protects the project from being judged by the sophistication of the method rather than by its results.
Once the baseline is in place, many retail teams find that gradient boosting and other tree-based models work well on tabular demand data with many features. Deep learning models can help at very large scale, but they need more data, more computing power, and more careful monitoring. The right choice depends on your data volume, the number of products and locations, and the team that will maintain the system.
For ranges of products that share patterns, consider hierarchical forecasting. You forecast at a higher level, such as category or region, and then reconcile the detailed forecasts so the totals add up. This helps with sparse products, where the history for a single SKU in a single store is too thin to learn from alone.
Google Cloud's documentation on forecasting with AutoML walks through the same workflow described here: preparing tabular training data, training a model, evaluating it, and generating predictions. It is a useful reference if your team is evaluating managed tools, although the design choices still need to come from your business rules.
Step 5: Handle promotions and new products
Promotions need separate treatment because they change demand in several ways at once. A practical approach is to model baseline demand separately from promotional lift. Baseline demand is what would sell without a promotion. Lift is the extra demand the promotion creates. Include a post-promotion dip, so the model does not overstate demand immediately after a campaign ends.
Promotion history is often incomplete. Some promotions are recorded in the marketing calendar but not in the pricing system, or the reverse. Reconcile these sources before training, because a model cannot learn a promotion it never saw.
New products need a different approach. Forecasting from zero history produces unreliable numbers. A cold-start method works better. Match the new item to similar products by category, price band, and attributes, then use the early sales curves of those products as a starting point. Update the forecast as real sales come in, and set a clear date after which the item's own history takes over.
Short-lifecycle items, such as fashion or seasonal goods, benefit from the same logic. Plan for them to be updated frequently, and set limits on how much stock is committed before the early sales results are known.
Step 6: Connect the forecast to replenishment
A forecast is useful only when it changes an order. Link the forecast to replenishment rules in three places.
Safety stock protects against uncertainty. Size it using the forecast error distribution for each product, not a single fixed percentage across the whole range. A product with stable demand needs less buffer than one with volatile demand.
Reorder point equals expected demand during the supplier lead time, plus safety stock. If your lead time is long, the forecast horizon must be at least as long, or you will not see problems coming.
Order quantity depends on minimum order sizes, storage limits, case packs, and the cost of placing orders. The forecast tells you how much demand to expect. These constraints tell you how to turn that demand into a purchase. Once the rules are set, AI automation can route approved orders and flag exceptions to the right person.
Different products deserve different service levels. A top-selling item that customers cannot easily replace may need a higher service level than a seasonal novelty. Higher service levels increase inventory, so set them on purpose, category by category, rather than applying one target to everything.
Step 7: Evaluate the forecast properly
Evaluation is where many forecasting projects go wrong. A model can look excellent in a demo and still fail when it meets real decisions. Use the practices below to avoid that.
Use a time-based test. Train on older data and test on newer data. Random splits mix future information into the training set and inflate results. Use rolling-origin evaluation instead. The model is trained on data up to a point, tested on the next period, and then the window moves forward. This mirrors how the forecast will be used in production. Forecasting: Principles and Practice by Rob Hyndman and George Athanasopoulos is a widely used reference on these methods, including time series cross-validation, for teams that want the statistical background.
Choose error metrics that fit the business. No single number tells the whole story. The table below summarizes the most useful measures.
| Metric | What it tells you | When to use it |
|---|---|---|
| Mean absolute error (MAE) | The average size of the miss, in units | Easy to explain to planners and buyers |
| Root mean squared error (RMSE) | Penalizes large misses more heavily | When big errors are especially costly |
| Mean absolute scaled error (MASE) | Compares the model with a simple benchmark, where below 1 means it beats the benchmark on average | When comparing products with very different sales volumes |
| Bias | Whether the forecast runs consistently high or low | Always, because a model can have low average error and still overstock every week |
Percentage errors such as MAPE can mislead when sales are near zero, which is common for slow-moving items. Use them carefully, or leave them out for those products.
Measure the business outcome too. Track overstock units or days of cover, markdown rate, stockout days, estimated lost sales, fill rate, and inventory turns. A forecast that improves accuracy slightly but cuts stockouts for your most important categories may be worth more than a larger improvement in a category that barely matters.
Evaluate by segment. Overall accuracy can hide serious problems. Check results separately for high-volume and low-volume products, new and mature items, promoted and non-promoted weeks, and each region or channel. A model that works well for the total may still miss badly for a key store.
Compare against the current process. Measure the existing planning method on the same test period. Only then can you say the new approach is better, and by how much.
Test the decision, not just the forecast. Run a simulation that applies the forecast to replenishment rules and counts the overstock and stockout outcomes that would have resulted. This connects accuracy to the thing the business cares about.
Step 8: Deploy in a controlled way
Once the model performs well in testing, move to production carefully. A practical rollout looks like this.
- Run in parallel. Generate forecasts alongside the current process for several planning cycles. Compare the orders each method would have produced, and what actually happened.
- Involve planners. Let planners review the forecasts, see why the model made each call where the system allows it, and record overrides with reasons.
- Go live in a limited scope. Choose one category, region, or channel where the results are strongest and the business impact is clear.
- Expand after results hold. Add categories only after the limited rollout performs as expected over more than one cycle.
Set alert thresholds before launch. Watch for data pipeline failures, such as missing sales days or late feeds. Watch for drift, which means changes in customer behavior or product mix that the model has not seen before. Track forecast bias over time, because a steady drift upward or downward usually points to a real change in demand or a data problem.
Plan a retraining schedule, and document each model version. When a forecast changes, you should be able to say which model version produced it and what data it used.
Step 9: Put governance around overrides
Human planners add real value. They know about a new competitor, a supplier delay, a local event, or a product problem that the data does not show yet. The problem is not overrides. The problem is undocumented overrides that cannot be learned from or audited.
Create a simple override log. Each entry should include the product, the change, the reason, and the outcome. Review the log monthly. Overrides that consistently improve results should inform the model. Overrides that consistently make results worse should stop, or the team should understand why they were made.
Assign clear ownership. One person or team should be accountable for the forecast, its accuracy, and its use in replenishment. Without that owner, the model becomes one more report that no one trusts.
Common mistakes to avoid
- Starting with the most complex model. Clean data, a clear baseline, and the right evaluation matter more than the model type.
- Ignoring stockouts in the training data. This teaches the model that low sales are normal demand, which keeps the stockout cycle going.
- Forecasting only at one level. Errors at store and SKU level can cancel out in a total, which hides the real problem where customers are disappointed.
- Measuring accuracy without business outcomes. Accuracy alone does not show whether overstock, markdowns, and stockouts improved.
- Skipping the link to replenishment. A better forecast that nobody uses changes nothing.
- Using one safety stock rule for every product. Demand variability and the cost of a stockout differ by product, so the buffer should too.
- Trusting vendor numbers without a baseline. Published claims often do not disclose the data, methods, or comparison used. Your own pilot is the result you can rely on.
A checklist before you start
Use this list to decide whether your organization is ready for a pilot:
- Sales history is available at the level you plan, such as SKU and store or channel.
- Stockout days can be identified in the data.
- Promotion and price history is recorded, even if it lives in more than one system.
- There is a named owner for the forecast and for the replenishment decisions it feeds.
- The current forecasting process can be measured on the same test period, so you have a baseline.
- Planners have a way to record overrides and reasons.
- Success measures are agreed before the pilot starts, including both accuracy and business outcomes.
If several of these are missing, start there. Better data and clearer ownership usually produce more value than a more advanced model.
Illustrative example: a seasonal home goods range
The following scenario is hypothetical. It is included to show how the evaluation works and does not represent a client result or measured outcome.
Imagine a home goods retailer with 40 stores and a seasonal range of scented candles. The current process uses last year's weekly sales with a manual adjustment. Planners see overstock in January and frequent stockouts of popular scents in late November.
The team gathers two years of store-level sales, stockout flags, promotion calendars, and holiday data. They build a model and compare it with a seasonal naive baseline using rolling-origin tests across the previous season. They review MAE, bias, and MASE by category. They also count the stockout days for the top 50 scents, which the business cares about most.
The model is accepted for two categories, where it beats the baseline on error and bias. For a slow-moving category with very little history, the team keeps the existing process and adds a cold-start rule for new scents. That decision matters as much as the model. Forecasting should be applied where it proves useful, and kept out of places where the data cannot support it.
Frequently asked questions
What is AI demand forecasting for retailers? AI demand forecasting for retailers uses machine learning to predict how much of each product customers will buy, by store, channel, or region, and by time period. It learns from sales history, seasonality, promotions, prices, and other signals. The forecast then drives ordering and replenishment decisions.
How can AI reduce overstock without increasing stockouts? AI reduces overstock by lowering forecast error, so orders are closer to real demand. It protects against stockouts by spotting demand changes earlier and by setting safety stock based on forecast uncertainty rather than a fixed buffer. Both results depend on clean data, correct handling of stockouts, and a direct link to replenishment rules.
What data do you need for retail demand forecasting? At minimum, you need accurate sales history at the level you plan, such as SKU and store or channel. Inventory and stockout records, promotion calendars, and a calendar with holidays are also important. Pricing, product attributes, and supplier lead times improve results further.
How do you measure whether a demand forecast is good? Use a time-based test with rolling-origin evaluation. Measure error with MAE, RMSE, or MASE, and check bias to see whether the forecast runs high or low. Then measure business outcomes such as overstock, markdowns, and stockout days, and compare everything with your current process.
How long does it take to build a retail demand forecasting model? The timeline depends on data readiness, the number of products and locations, and the number of systems involved. Data preparation usually takes the most time. A focused pilot in one category or region is often the fastest way to test value before scaling.
Next steps
If you want to test AI demand forecasting, start with one category or region and a clear baseline. Choose one product group, measure its current results, and run the pilot for several planning cycles before you scale.