Stock is not visible across channels
Storefront, marketplace and warehouse stock levels are updated at different times, so the same item is sold twice or shown as unavailable.
Impact: Cancelled orders, lost sales and customer complaints.
Retail data is spread across storefronts, marketplaces, point-of-sale, warehouses and advertising platforms. We unify these sources so merchandising, inventory and marketing teams can see stock, sales and margin for each product and location in one place.
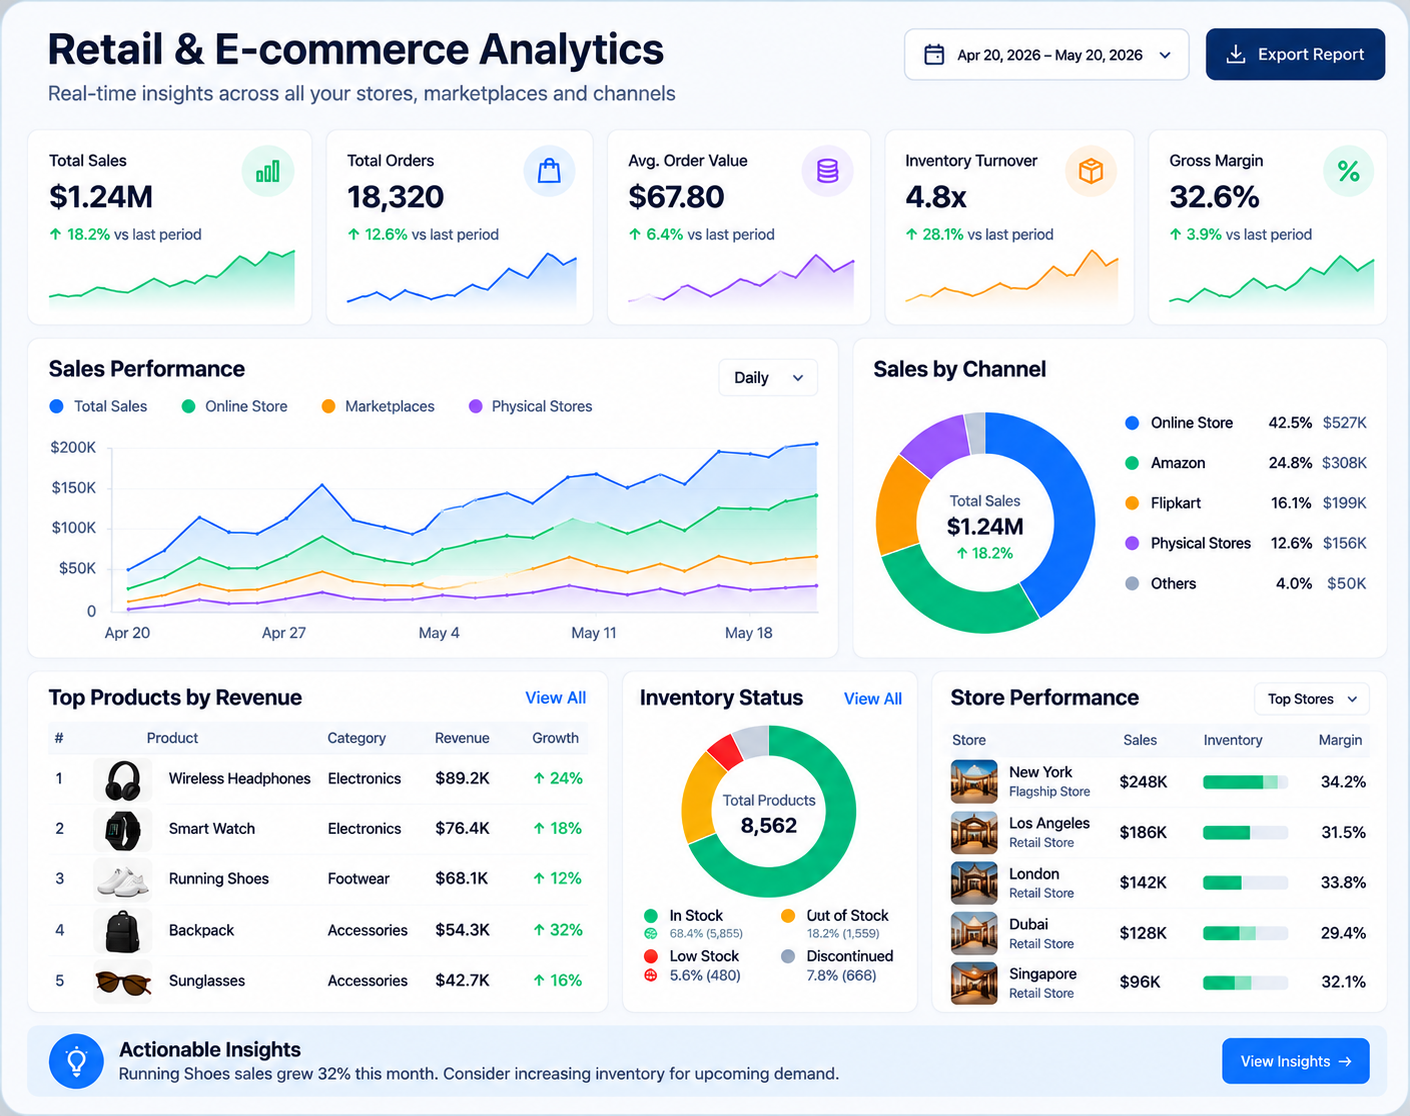
The channel problem
A retail or e-commerce business sells through several channels, and each keeps its own version of stock and sales. The storefront, the marketplaces, the stores and the warehouse update at different times and in different formats. The result is overselling on one channel, idle stock on another, and product margins nobody can calculate with confidence.
We unify product, order, stock and settlement data under one identifier. Margin is calculated after returns, marketplace fees, shipping and discounts. Demand estimates feed directly into AI demand forecasting for inventory, and the same sales data supports intelligent order processing across channels. Teams planning a broader machine learning programme start from this governed base.
Channels and systems
We confirm what each system exposes, how often it can be refreshed and who owns the data, before the design is final.
E-commerce storefront
Orders, customers, product catalogue and discounts
Marketplaces
Marketplace orders, fees and settlements
POS and store systems
In-store sales and returns
Warehouse and inventory system
Stock levels, transfers and receipts
Advertising and analytics platforms
Spend, impressions and campaign results
What it costs
Storefront, marketplace and warehouse stock levels are updated at different times, so the same item is sold twice or shown as unavailable.
Impact: Cancelled orders, lost sales and customer complaints.
Revenue is reported per channel, but returns, fees, shipping and discounts are not allocated to products.
Impact: Decisions about pricing and range are based on revenue rather than profit.
Ad platform data and order data are reported separately, with different attribution windows.
Impact: Budget moves toward the metrics that look good in each platform.
Weekly spreadsheets are assembled by hand, and promotions are reviewed after they end.
Impact: Stock and pricing corrections come too late to matter.
Retail data model
Frequent loads of orders and stock from storefronts and marketplaces, with daily settlement and fee data.
A product, location and channel model with a single product identifier that maps every source.
Contribution margin by product after returns, fees, shipping and discounts, using agreed rules.
Inventory, sales and margin dashboards for merchandising, plus campaign performance reporting for marketing.
Commercial measures
Each measure is baselined before the project starts, so improvement is shown against your own starting point.
| Measure | How it is calculated | Why it matters |
|---|---|---|
| Oversold orders | Orders accepted for stock that was not available | Shows the cost of stale stock data |
| Stock-out days | Days a product was unavailable on a channel where it was listed | Links availability to lost sales |
| Contribution margin by product | Revenue after returns, fees, shipping and discounts, per product | Shows which products deserve investment |
| Campaign return on spend | Margin generated per unit of marketing spend, on a consistent attribution basis | Makes budget decisions comparable across platforms |
| Data freshness | Time between a sale or stock change and its appearance in dashboards | Shows whether stock decisions use current data |
Illustrative scenario
This is an illustrative scenario, not a verified client result. Measured outcomes are shared only from real projects, with their baseline and method.
The challenge
A brand sells through its own site, two marketplaces and its stores. Stock is updated in batches, so the same units are sometimes sold on more than one channel.
The approach
What we measure: Oversold orders, stock-out days, margin per product after channel costs. Measured against a baseline from before the project.
Implementation path
Each phase ends with a defined output. Timelines are estimated after the assessment, once sources and scope are confirmed.
We map each channel, its data and its refresh options, and check how products are identified across systems.
Output: Channel map and product identifier plan
We agree which costs are allocated to products, how returns are treated, and which attribution window marketing uses.
Output: Margin and attribution rule book
We build the order, stock and settlement loads at the frequency each channel needs, with a single product and location model.
Output: Unified retail data model
We publish stock, sales and margin dashboards, with alerts when a product approaches a stock threshold or margin drops.
Output: Merchandising and marketing dashboards
We review performance with merchandising each month and refine the rules as new channels or products are added.
Output: Monthly review and rule updates
Rules and access
Controls are agreed for each project, based on the sensitivity of the data and the rules that apply to your organisation.
Dashboards and rules
Retail questions
Usually, through marketplace APIs, reports or settlement files. We confirm the available data and its refresh frequency during the assessment.
We agree the cost rules with finance and merchandising, such as which fees, returns and shipping costs are allocated to each product, and implement them consistently.
Yes. Attribution windows and definitions are agreed and documented, so campaign results are reported on a consistent basis.
It depends on the source systems. Some can refresh every few minutes through APIs, others daily. The refresh design follows the risk of overselling for each channel.
Yes. Each marketplace's fees and settlement timing are modelled separately, then combined into one margin view, so differences between channels remain visible.
The dashboards are designed for the questions each team asks, with agreed definitions and short training. Ongoing support is included in a support agreement.
A data platform assessment maps your systems, the reports that matter and the decisions they support, then gives you a practical first step.
Tell us about your business goals and challenges. Our experts will get back to you within one business day with a free, no-obligation consultation.
100+ Projects Delivered
5+ years expertise
Free Consultation
Fill out the form and our team will get in touch with you shortly.
Free
Consultation
Quick
Response
Dedicated
Support