AI In Supply Chain Optimization: 2026 Complete Guide
Modern supply chains are incredibly complex: thousands of suppliers, multiple distribution channels, volatile demand, geopolitical disruptions, and cost pressures from every direction. dpdp penalties explained
Yet most organizations still manage supply chains with spreadsheets, manual forecasts, and reactive problem-solving.
This approach leaves enormous value on the table: 15–25% higher inventory costs, 10–15% logistics waste, and constant stockouts or overstock situations.
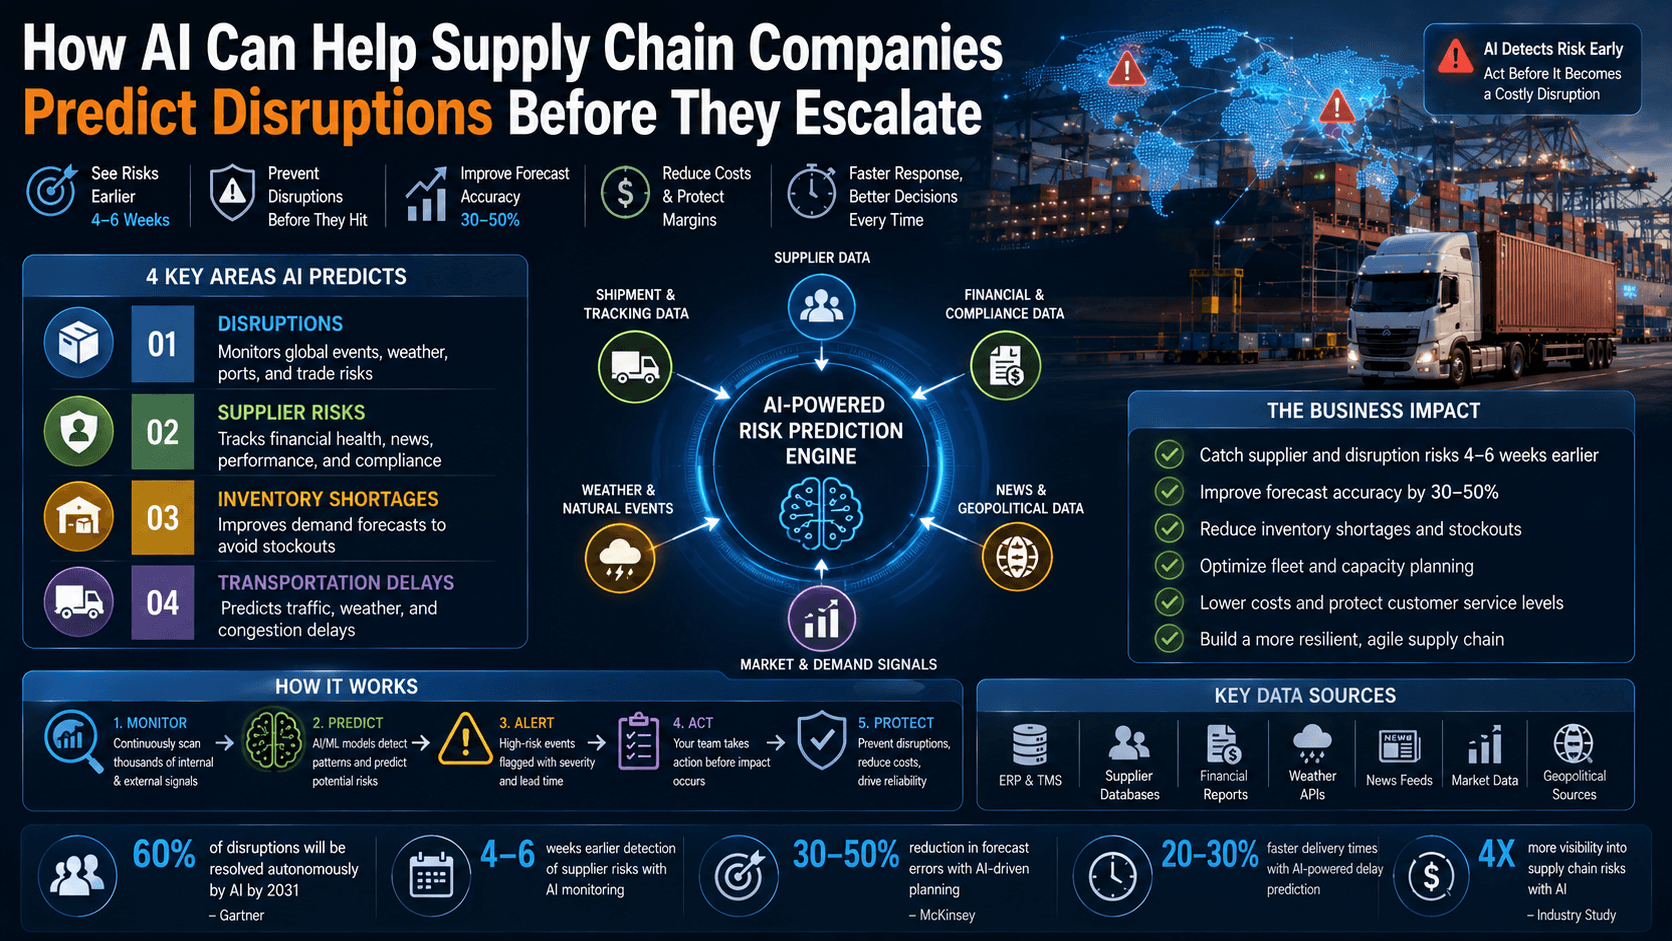
AI-powered supply chain optimization fixes this systematically, delivering 15–30% cost reductions while improving reliability.
The Supply Chain Opportunity
A typical $1B revenue company has:
- $200M+ in inventory across supply chain (carrying costs alone: $30–40M annually)
- $150M+ in logistics spend (20% waste from inefficiency)
- 50+ critical suppliers (visibility limited to spot checks)
- 10,000+ SKUs (manual forecasting breaks down)
- Multiple fulfillment centers (inventory distribution suboptimal)
AI addresses every component.
1. Demand Forecasting: From Guesswork to Precision
The Problem
Traditional demand planning relies on:
- Historical averages (ignores trends)
- Spreadsheet forecasts (slow, static)
- Salesperson estimates (optimistic bias)
- Gut feel (inaccurate and inconsistent) what is dpdp act 2023
Result: Average forecast error of 30–40%, leading to either:
- Overstock: Excess inventory sitting on shelves, tying up cash
- Stockout: Losing sales, disappointing customers, shipping rush orders at premium cost
How AI Forecasting Works
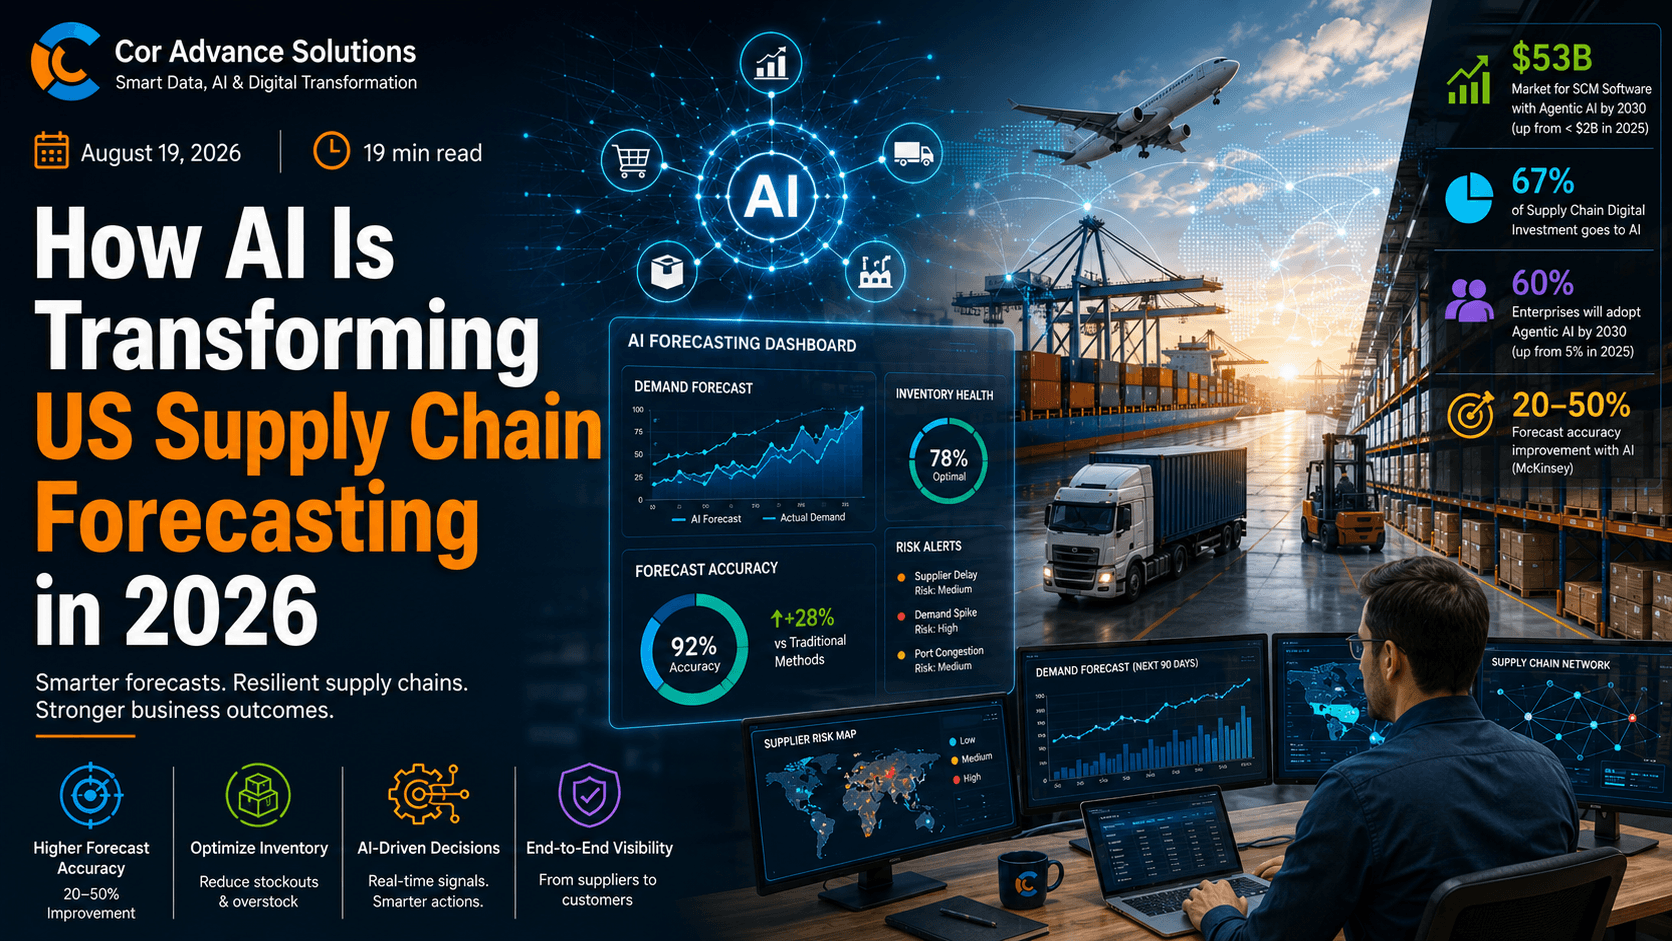
AI models analyze:
- Historical sales patterns — trends, seasonality, cyclicality
- External factors — holidays, events, weather, economic indicators, competitor activity
- Leading indicators — website traffic, social media mentions, pre-orders, search trends
- Causal data — pricing changes, promotions, supply disruptions, customer lifecycle
Models update continuously as new data arrives.
Real Impact
Example: Mid-market Retailer
- Before AI: ±35% forecast error
- After AI: ±12% forecast error
- Result: 20% reduction in excess inventory, 15% reduction in stockouts, $8M cash freed
Example: Manufacturer
- Before AI: Forecast demand at aggregate level only
- After AI: Forecast by customer, product, geography
- Result: 25% improvement in inventory turns, 18% cost reduction
Implementation
- Data integration — Connect sales, inventory, web analytics, supplier data
- Model training — Build AI models on 2–3 years of historical data
- Validation — Test against recent history, measure accuracy
- Deployment — Integrate into planning systems, update forecasts weekly
- Continuous improvement — Measure actual vs. predicted, refine models dpdp vs gdpr
Timeline: 6–8 weeks to first production forecast
2. Inventory Optimization: The Right Stock at the Right Time
The Problem
Manual inventory planning relies on rules:
- "Keep 4 weeks of safety stock"
- "Reorder when inventory drops below 200 units"
- "Stock this much before holidays"
These rules are:
- Too simplistic — Don't account for demand variability
- One-size-fits-all — Don't adapt to individual product characteristics
- Static — Don't respond to changing conditions
- Expensive — Excessive safety stock to avoid stockouts
Result: 20–30% excess inventory, yet still 5–10% stockout rate.
How AI Solves It
AI calculates optimal stock levels for each product considering:
- Demand variability (what's the worst-case demand this week?)
- Lead time (how long to replenish this item?)
- Service level target (how often can you stockout? 1% is standard)
- Holding cost (how expensive is excess inventory?)
- Stockout cost (what's the cost of being out of stock?)
Formula: Optimal safety stock = Service factor × Demand variability × Lead time AI & Machine Learning
AI continuously recalculates as conditions change.
Real Impact
Example: Manufacturing Company
- Before: $50M inventory at 65% turns
- After AI: $40M inventory at 85% turns
- Cash freed: $10M, Carrying cost savings: $3M annually
Example: Food Distributor
- Before: Overstock on perishables, 8% waste rate
- After AI: Optimized rotation, 3% waste rate
- Result: $2.1M annual savings from reduced waste
3. Logistics Optimization: Moving Goods Efficiently
The Problem
Logistics decisions are often made independently:
- Carrier selection: Choose carrier based on price alone, ignoring service level
- Route planning: Manually create routes, miss efficiencies
- Warehouse location: Historical decisions, suboptimal for current demand
- Consolidation: Ship less-than-truckload when consolidation possible
- Mode selection: Don't optimize sea vs. air vs. ground strategically
Result: 10–20% waste in logistics spend.
How AI Optimizes Logistics
AI considers all factors simultaneously:
- Total landed cost: Not just shipping cost, but acquisition + shipping + duties + handling
- Service level required: Premium (2-day), standard (5-day), economy (7-10 day)
- Consolidation opportunities: Bundle shipments to the same region
- Warehouse positioning: Store high-demand items near customers
- Carrier performance: Track on-time delivery, damage, and costs by carrier
Real Impact
Example: Global Electronics Company
- Before: Largely air-shipped, high cost
- After AI: Optimized sea + ground combinations, premium air for exception cases
- Result: 28% reduction in logistics cost while maintaining 99%+ on-time delivery Manufacturing
Example: Fashion Retailer
- Before: Regional warehouses far from customers
- After AI: Rebalanced inventory to regional hub model
- Result: 23% faster average delivery, 15% lower logistics cost
4. Supplier Risk Management: Seeing Issues Before They Occur
The Problem
Supplier issues create cascading disruptions:
- A key supplier has quality issues (discovered when defects arrive)
- A supplier faces financial stress (you find out when they go bankrupt)
- A supplier is running behind schedule (you find out when shipment is late)
Result: Emergency sourcing (30–50% premium costs), production delays, lost sales.
How AI Manages Supplier Risk
AI monitors:
- Financial health — Payment history, credit ratings, bankruptcy indicators
- Quality trends — Defect rates, complaints, returns increasing?
- Delivery performance — On-time %, lead time trends, capacity issues
- Market indicators — News, social media, industry data about supplier
- Contract compliance — Pricing, terms, SLA adherence
AI flags risk before it becomes a problem.
Real Impact
Example: Automotive Supplier
- AI flagged financial stress at key supplier (3 months early)
- Company diversified sourcing before supplier failed
- Avoided $50M+ disruption cost ai demand forecasting ecommerce
Example: Electronics Manufacturer
- AI detected quality degradation at supplier
- Initiated early corrective action discussions
- Prevented 10,000+ unit defect recall
5. Procurement Optimization: Buying Smarter
The Problem
Traditional procurement is:
- Manual: Buyers get calls, send quotes, compare prices
- Slow: Days or weeks to source new items
- Expensive: No systematic negotiation, higher prices
- Inconsistent: Different buyers use different suppliers
How AI Optimizes Procurement
AI:
- Aggregates spend — Consolidates buying across company, increases bargaining power
- Identifies alternatives — Finds multiple suppliers, compares quality + price
- Benchmarks pricing — Knows what market prices are, alerts when quotations are high
- Predicts total cost — Accounts for quality, lead time, payment terms, not just unit price
- Automates RFQs — Generates requests for quotes, compiles responses, ranks suppliers
Real Impact
Example: Manufacturing Company
- Spent $500M annually on procurement
- AI identified consolidation opportunity (70 suppliers → 20 key suppliers)
- Result: $45M cost savings (9% reduction) + improved quality + faster delivery
Implementation Roadmap
Phase 1 (Months 1–2): Foundation
Phase 2 (Months 3–4): Demand Forecasting
- Deploy demand forecast AI
- Integrate into planning systems
- Measure forecast accuracy improvements
Phase 3 (Months 5–6): Inventory Optimization
- Calculate optimal stock levels
- Implement new safety stock policy
- Measure inventory reduction and service improvement
Phase 4 (Months 7–8): Logistics & Procurement
- Optimize carrier selection and routing
- Deploy procurement cost analytics
- Achieve cost savings
Phase 5 (Months 9+): Risk Management
- Implement supplier monitoring
- Integrate market intelligence
- Establish early warning system
Financial Impact
Typical mid-market company ($500M revenue):
Annual Supply Chain Spend:
- Inventory carrying costs: $20M
- Logistics costs: $30M
- Procurement costs (excess): $15M
- Safety stock (non-value-adding): $8M
- Total optimization opportunity: $73M AI Services Hub
Year 1 Savings with AI:
- Demand forecasting: 15% demand planning cost reduction = $6M
- Inventory optimization: 18% inventory reduction = $3.6M
- Logistics optimization: 22% cost reduction = $6.6M
- Procurement: 8% savings = $4M
- Risk mitigation (prevented disruption): $2–3M
- Total Year 1 Savings: $22–24M
Year 1 Costs:
- AI platform licenses: $300K–$500K
- Implementation: $800K–$1.2M
- Training: $200K–$300K
- Total: $1.3–$2.0M
Year 1 ROI: 1,100–1,850%
Critical Success Factors
✅ Executive sponsorship — Supply chain optimization requires cross-functional change
✅ Data quality — Garbage in, garbage out; invest in data cleaning first
✅ Process integration — AI works best integrated with existing planning systems
✅ Change management — Planners and buyers need training on AI recommendations
✅ Continuous measurement — Track actual vs. forecast, measure savings rigorously
✅ Governance — Define who owns procurement decisions, exception handling
Getting Started
-
Audit your current state:
- What's your forecast error? (target: <15%)
- How many days of inventory? (target: 30–45 days)
- What % of freight is consolidated? (target: 70%+)
- How many suppliers per category? (target: 3–5)
-
Identify biggest opportunity:
- Excess inventory eating cash?
- Logistics costs out of control?
- Frequent stockouts?
- Supplier issues?
-
Run pilot on highest-opportunity area:
- Pilot demand forecasting on 20% of SKUs
- Measure accuracy improvements
- Roll out if successful
-
Scale to full supply chain:
- Inventory optimization
- Logistics and procurement optimization
- Supplier risk management
Ready to optimize your supply chain? Cor Advance Solutions helps companies implement AI-powered supply chain solutions that reduce costs and improve reliability. Let's discuss which supply chain challenge would have the biggest impact on your business.