No single view of plant performance
Output comes from the MES, orders from the ERP and defects from quality logs, and no one view combines them.
Impact: Slow root-cause analysis and disagreement about what actually happened on the line.
Production data lives in ERP, MES, quality systems and machine sensors, and it rarely agrees with itself. We build integrated manufacturing data platforms that combine these sources into dashboards for output, downtime, quality and cost, so plant and head-office teams work from the same numbers.
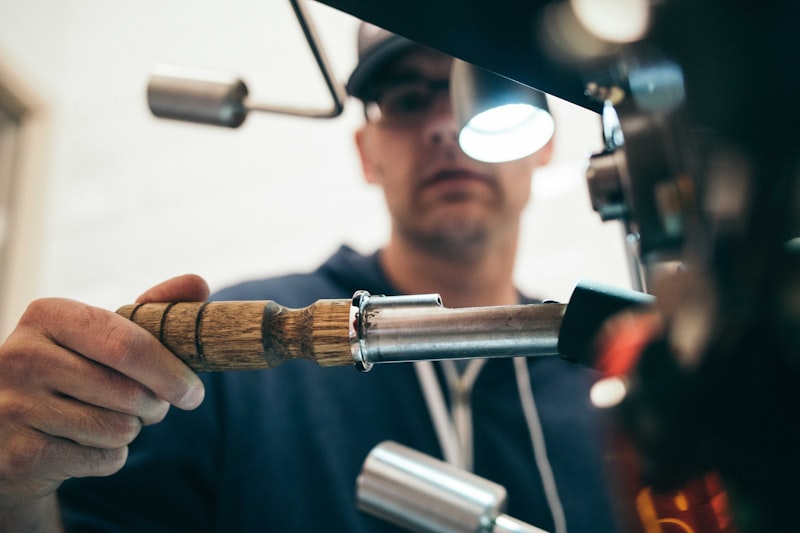
On the shop floor
Output comes from the MES, orders from the ERP and defects from quality logs, and no one view combines them.
Impact: Slow root-cause analysis and disagreement about what actually happened on the line.
Availability, performance and quality are estimated from shift reports, so the figures arrive late and vary by plant.
Impact: Improvement work is based on incomplete numbers.
Machine data is stored but not joined with production orders, maintenance records or shift information.
Impact: Downtime is explained after the event rather than prevented.
Material usage, scrap and rework are closed at month-end, long after the production run.
Impact: Corrective action comes too late to protect margin.
Context
A plant generates a large amount of data, spread across the ERP, the MES, quality management, maintenance and machine controllers. Each system records a different part of the same event. When a line stops, the cause may be visible in the machine log, the work order and the quality record, yet the link between them is made by hand, often days later.
We join these records on common keys such as work order, machine, shift and batch, and calculate OEE, scrap and downtime once with agreed definitions. This is the foundation for predictive maintenance and for production planning with machine learning, because models are only as reliable as the shop-floor data beneath them. Plants running older lines can also review legacy system modernisation alongside the data work.
Plant data architecture
Batch loads from ERP and quality systems, plus streaming or frequent pulls from MES and machine data where the plant allows.
Time-aligned production models that join orders, runs, machines, shifts and defects on common keys.
Agreed OEE, scrap and downtime definitions implemented once and reused in every dashboard.
Plant and head-office dashboards, alerts for abnormal states, and exports for planning systems.
Rollout
Each phase ends with a defined output. Timelines are estimated after the assessment, once sources and scope are confirmed.
We review the ERP, MES, quality and maintenance systems at each site, and confirm what machine and PLC data can be collected.
Output: Site assessment and data availability map
We agree shared codes for runs, downtime reasons, defects and shifts, so that data from different plants can be compared.
Output: Production data model and code list
We build the batch and frequent loads, validate machine and quality data before it feeds calculations, and implement the OEE and scrap rules.
Output: Integrated pipeline with validation
We publish line-level dashboards for plant teams and head-office views, with alerts for abnormal machine states and quality trends.
Output: Dashboards and alert rules
We roll out site by site, train supervisors and engineers, and review the dashboards with them each month.
Output: Rollout plan and training material
Plant systems
We confirm what each system exposes, how often it can be refreshed and who owns the data, before the design is final.
ERP
Orders, bills of materials, inventory and cost centres
MES and shop-floor systems
Production runs, cycle times and work orders
Quality management
Inspections, defects, non-conformance records
Machine sensors and PLC data
States, counts, temperatures and alarms
Maintenance system
Work orders, failures and planned stops
Plant measures
Each measure is baselined before the project starts, so improvement is shown against your own starting point.
| Measure | How it is calculated | Why it matters |
|---|---|---|
| OEE by line and shift | Availability, performance and quality, calculated from the same definition at every site | Shows where capacity is lost |
| Unplanned downtime | Hours of unplanned stops, grouped by cause and machine | Shows which failures to address first |
| Scrap and rework cost | Material and labour cost of defective output, linked to runs | Links quality problems to money |
| Reporting lag | Time between a production event and its appearance in reports | Shows how quickly teams can react |
| Cross-plant comparability | Share of plants reporting on the same definitions | Makes benchmarking between sites meaningful |
Outputs
Illustrative scenario
This is an illustrative scenario, not a verified client result. Measured outcomes are shared only from real projects, with their baseline and method.
The challenge
A manufacturer runs two plants with different MES versions. Each plant calculates OEE differently, and head office receives the figures a week late.
The approach
What we measure: Reporting lag, agreement between plant figures, time to identify top downtime causes. Measured against a baseline from before the project.
Data quality
Controls are agreed for each project, based on the sensitivity of the data and the rules that apply to your organisation.
Plant and IT questions
Usually yes, through the systems' exports, database access or APIs. We confirm what each system exposes, and how frequently the data can be refreshed, during the assessment.
Yes, where the data can be collected from PLCs, historians or gateways. The volume and frequency determine the storage and processing design.
We agree one definition with plant and finance leaders, implement it once in the data model, and document any local differences that the business decides to keep.
Yes. Dashboards can be designed for shop-floor screens or tablets, with the same underlying data as head-office reports.
No. The platform reads data from the existing systems. Changes to shop-floor codes are sometimes needed for consistent reporting, and we agree these with plant teams.
We map each version's data to the common model. Differences that cannot be mapped are documented, so reports show their limits clearly.
A data platform assessment maps your systems, the reports that matter and the decisions they support, then gives you a practical first step.
Tell us about your business goals and challenges. Our experts will get back to you within one business day with a free, no-obligation consultation.
100+ Projects Delivered
5+ years expertise
Free Consultation
Fill out the form and our team will get in touch with you shortly.
Free
Consultation
Quick
Response
Dedicated
Support